Practical Advises
.
Regarding the ORSA-implementation there are concerns that the simulation of stress scenarios will be very complex and will lead at the end to an internal model. Instead, it is preferred to calculate only some selected scenarios. Basically, it is right to simplify as much as possible within the ORSA. The guidelines on the assessment of the continuous compliance with the regulatory capital requirements however require stress tests, reverse stress tests and scenario analysis. Thereto, it is much easier to perform the tests and analysis by a simple simulation model rather than on basis of detailed planning calculations. By the example of the valuation of the technical provisions of life insurers it will be shown, how such simplifications as well as a simulation model can work.
Example
Solvency II-Valuation: Principally, the Solvency II valuations refer to the current closing date and are not designed for planning purposes. For example, the Solvency II yield curve is derived from the currently observed market yield curve. Thus, within the planning process, the observable yield curves have to be modelled for every planning year at first and afterwards the respective Solvency II yield curves can be derived from modelled yield curves.
Assuming that the expected interest rates will follow the currently observed yield curve, the Solvency II discount factors will change within the planning period only by the discount factor of the preceding planning years (see figure 1).
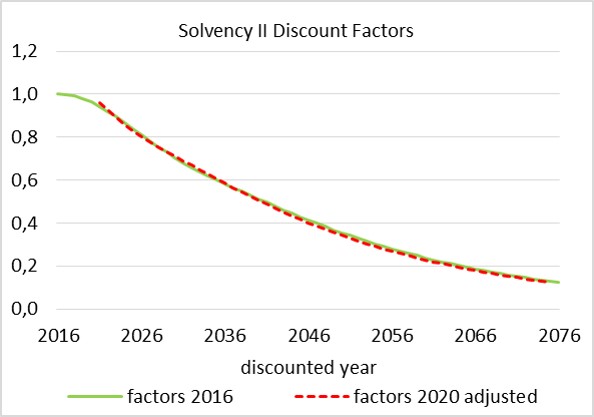
Figure 1
According this property, the future Solvency II yield curves can be derived from the current Solvency II curve in case of the expected, respective planning scenario. Within the scenario of a longer lasting low interest phase however, the current Solvency II yield curve can be applied for the period of low interest rates and thereafter the yield curves can be modified according the planning scenario. Furthermore, the scenario of a lower long-term interest rate level (respective of a lower Ultimate Forward Rate) is included in the calculation of the Solvency Capital Requirement as down-shock and therefore must not be calculated additionally as a stress scenario. By this properties the planning scenario and the main stress scenarios can be calculated in a simple way.
Planning: In our example we assume that the expected cash flows remain largely stable over the planning period. The uncertainties, which are included in the simplifying assumption, will thereby modelled as uniform distributed deviation of ± 2.5% between the forecasted cash of one planning year and the forecasted cash flow of the next planning year. Accordingly, the Monte Carlo simulation provides for each planning year a distribution of cash flows (see figure 2).
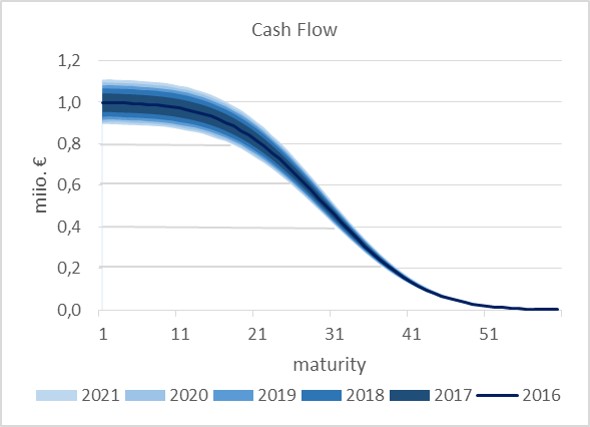
Figure 2
In turn, if the simulated cash flows are discounted under the planning scenario as well as under the scenario of longer lasting low interest rates, we obtain for each scenario also a distribution of Solvency II provisions. Thereby the distributions differ significantly from each other (see figure 3). This shows that simplified scenario calculations can provide meaningful results despite the included uncertainties.
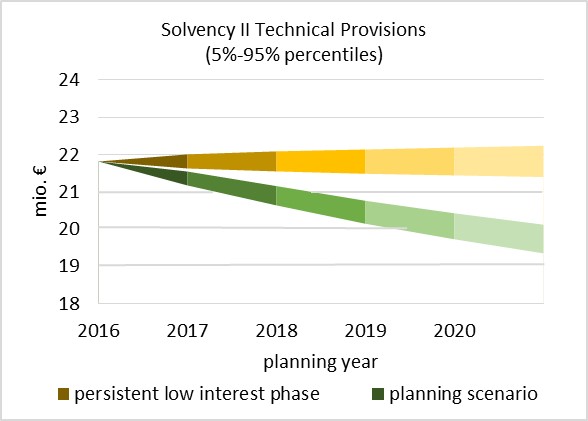
Figure 3
Simulation model: The model refers principally to the main planning variables and the undertakings risk strategy. The corresponding planning figures will be entered directly into the model. In the case of stress scenarios, the figures will be modified by management rules, which represent the risk strategy and which are triggered by the characteristics of the stress scenarios. The resulting cash flow and the respective financial figures (local GAAP and Solvency II), in turn, can be calculated by means of simplified rules (see figure 4). Thereby the rules may be provided by the competent business units.
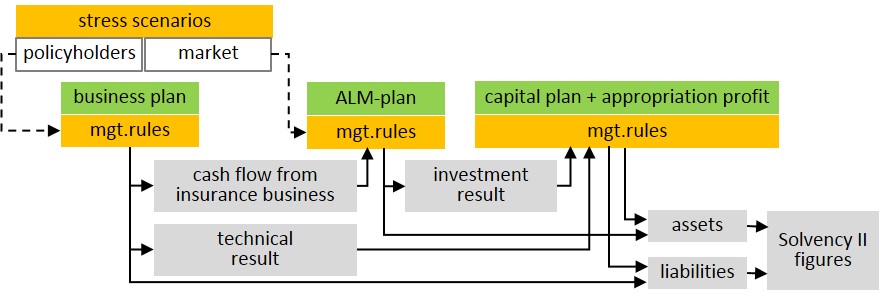
Figure 4
Conclusion
Basically, a model for the simulation of stress scenarios is not comparable with an internal model because the simulation model is designed to reflect only the most important relationships and calculates on basis of simplified rules.
But not only the required tests and analysis can be performed by the simulation model, but also the undertakings risk strategy can be adapted to the ORSA requirements. For example, the undertakings risk appetite in regard to the planning horizon can be represented by borderline scenarios, without having to calculate with probabilities. Thereby a borderline scenario describes the point from where on the undertaking has to take adverse actions from the shareholders perspective (i.e. restriction of profit distribution or raise of own funds) and where moreover negative Solvency II figures can result (see figure 5). An advantageous risk strategy is characterized by a maximal planning space for the management board and can be determined by the simulation model .
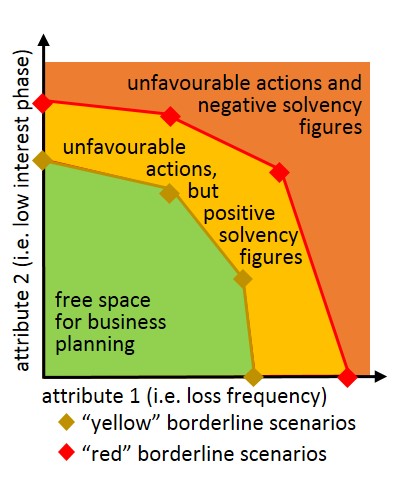
Figure 5
